What is The RSI Indicator?
The RSI stands for the relative strength index. It was developed by J. Welles Wilder and has been in the market since the year 1978.
It’s among the indicators that track the momentum of a market. Typically, the RSI helps traders gauge the strength of a market in terms of the velocity and magnitudes of changes in the price of an asset or currency pair.
RSI is presented as an oscillator on chart markets for technical analysis.

Generally, traders and market analysts use the RSI indicator to spot overbought or oversold markets. And the scores range from 1 to 100.
The standard scores for RSI indicate overbought for scores above 70. While the oversold RSI scores read 30 and below.
While the standards for oversold or overbought remain the 30 and 70, respectively, traders should not take them as absolute signals. This is because no trading indicator, inclusive of the RSI, is not 100% accurate.
In a later section, we’ll see later how to best work with the RSI in real trading strategies.
The surest way to work with the RSI indicator in a strategy is to work with it alongside other technical analysis tools. That way, a trader is able to filter out false signals.
Next, I’ll guide you in exploring trading strategies you can explore by relying on the relative strength index.
3 Strategies Using The RSI Indicator
1. Overbought\Oversold Markets

RSI is a reliable indicator for pointing out overbought markets. Here, the markets show the RSI oscillator scoring above 70.
Overbought markets attract supply pressure, and it’s where prices are deep into resistance zones.
Consequently, when enough sellers step into the market, they regain control of the market. Eventually, prices navigate to lower levels – from resistance zones.
As pointed out by the RSI, overbought markets may experience a bearish rally – prices stepping lower back to the support zones.
Once prices are back into support levels, the RSI reads oversold. And the scores hit 30 and lower on the RSI oscillator.
Now, with the markets oversold, prices are at their lowest levels – this is where demand for the assets starts building up. In other words, oversold markets are due to attract buyers’ interest.
As buyers keep stepping in, the buying pressure drives prices higher, and buyers regain control of the markets. Eventually, a market may experience a bullish rally.
In reality, the markets experience scores that are extreme – either between 30 and 70. Or far above or below. Traders should rely on RSI and enrich analysis with additional tools to predict and confirm price action direction before jumping into the markets.
Next is our strategy using RSI and market patterns.
2. Market Patterns
Markets show various formations across timeframes. Traders with a good knowledge of pattern analysis can rely on the RSI to confirm price signals before opening positions.
The RSI can help trade many patterns. These include the cup and handle and the head and shoulders patterns. And the two appear in bullish or bearish scenarios.
The list of patterns is long. But there is the unique section of harmonic patterns – these are picked according to observed formations that respect the golden ratios of Fibonacci numbers.
Examples of harmonic patterns are the crabs, gartley, sharks, and ciphers. Here, a trader confirms price movement with the RSI indicator against the rules of trading each of the harmonic patterns.
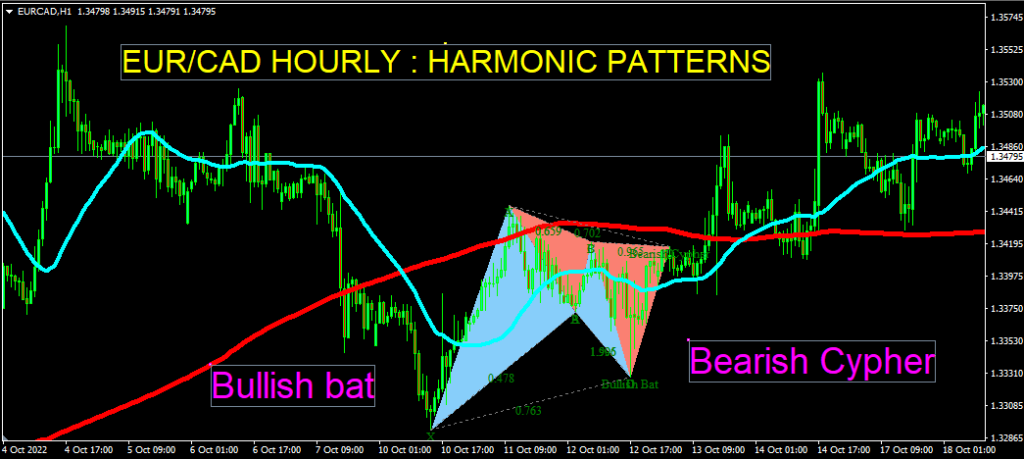
Therefore, the central point is enriching analysis using RSI indicators before making commitments.
Next, we’ll go over the strategy to trade the markets using the RSI and trends.
3. Trending Markets
Trending strategies are the easiest for new traders to work with and earn profits using the RSI indicator.
There are two scenarios here: one is using RSI to confirm the current trend. And the second one is using the RSI to spot indications of trend reversals.
Scenario 1: Confirming Trends using RSI Indicator
Using the RSI to confirm trend direction is the easier of the two approaches above. So, if the RSI retains an inclining angle, the trend is bound to remain upward into the future timeframes.
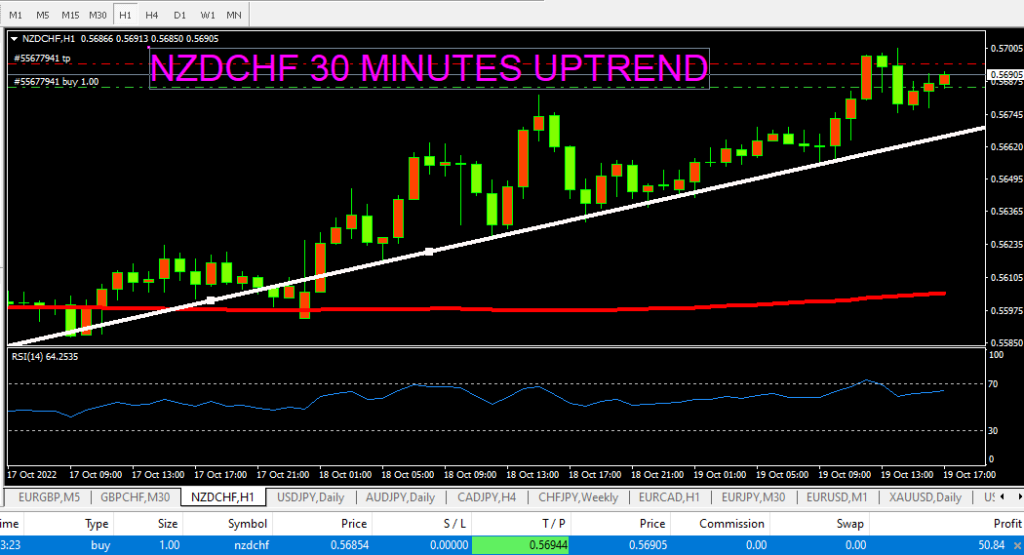
The other way around applies – when RSI shows a declining angle, the trend has a high probability of retaining the bearish sequence into future timeframes.
And using the RSI here requires a good grasp of the analysis of market trends.
Scenario 2: Confirming Trend reversal using the RSI Indicator
As markets trend up or down, there comes a time for a reversal. And the RSI momentum indicator is among the technical analysis tools to spot trend reversal signs.
This is a slightly complex analysis for a new trader, yet its principle is simple – it’s referred to as a divergence.
A divergence happens when RSI moves in a direction that is opposite to that of the trend. Therefore, the RSI will show a sloping angle for a bullish trend. And conversely, for a bearish trend, the RSI will show a climbing angle.
Notice that the RSI moves in a direction opposite of the trend slightly way before the actual trend reversal takes place.
So traders can use the strategy to approach markets by exiting trades and or placing stops to protect profit under the current trends. Alternatively, traders can wait for the trend to fully reverse and join in once they confirm a full reversal.
Up next is the key section on the mistakes to avoid while using the RSI indicator.
Mistakes to Avoid When Using The RSI Indicator
● Incorrect Reading of the RSI indicator
The first mistake that traders make is an incorrect reading of the RSI indicator. The standard figures remain 70 and 30 for overbought and oversold, respectively.
Yet, we say every indicator has some margins of errors. It’s best to explore and see which specific figures of the RSI apply to each market. For instance, work with a 90 for overbought and 20 for oversold.
The other way to increase accuracy with the RSI strategy is by analyzing the markets at higher time frames, for instance, the daily or weekly charts.
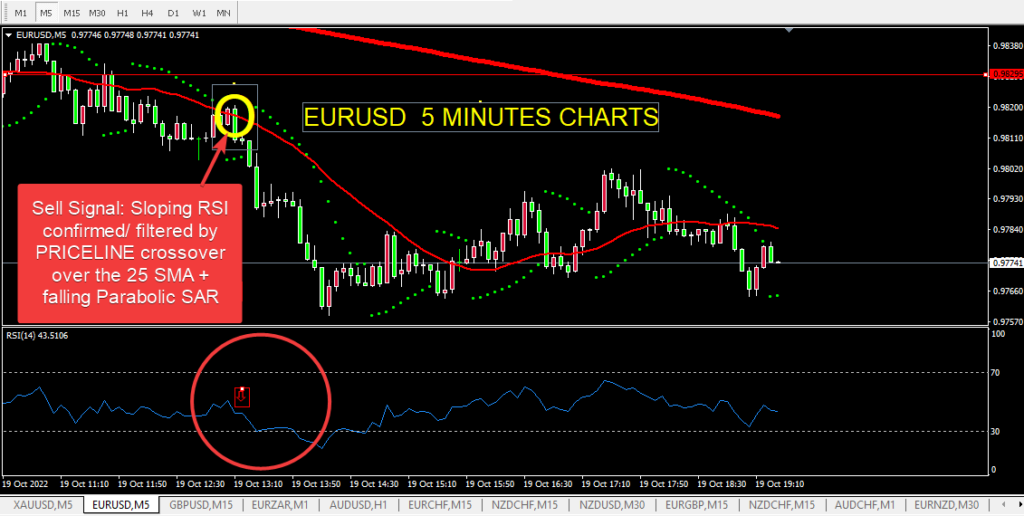
● Failing to Filter False signals
Traders should escape this failure by working with other signals concurrently. For instance, the parabolic SAR can confirm if the market momentum is falling alongside the RSI.
Another good approach is to check a signal with dynamic support and resistance zones. Check the long-time trend. Is it falling or rising? Are there clear formations like prices consolidating within a range?
So essentially, it’s critical to filter false signals with the RSI by working with a set of rules to observe before jumping into the markets. The additional part here is the discipline of a trader – to stay out of the markets when conditions or rules are flouted.
Catching a false signal ensures a trader protects capital for trading another prime opportunity in the future.
● Failing to use Stop Loss positions with RSI signals
Traders must avoid the temptation to open a position based on an RSI signal and fail to place a stop-loss position.
Why place a stop loss? A stop loss fulfills your market methodology or strategy. Every strategy has three core price positions: entry, exit, and stop loss.
You do not know what will happen in the next few minutes in the markets. RSI indicator, like others, is not 100 percent accurate. There are real market risks out there.
Good trading works with the what-if approach. So, place a stop-loss position in case prices move adversely against your predictions.
The ideal approach here is to protect your capital. With capital, you have very many opportunities to trade and recover the amounts you lost for a few bad trades.
At one time, the RSI indicator will give you a great signal and grow your account fearlessly. Also, adjust the stop loss once a trade jumps in your favor. Start with a break-even position and set it to secure some reasonable reward. But never trade without a stop loss. You now know better why.
Conclusion
In this video, we’ve looked at the RSI momentum indicator and three key strategies you can ride on to trade the markets. There are many more strategies with the RSI to explore.
Also, we’ve looked at three mistakes you can avoid while analyzing and trading with strategies relying on the RSI indicator.
Overall, while using strategies based on RSI, work with an entry point that has a target exit. And cover them with a stop-loss position

James is a finance writer, and content marketing specialist. He often writes about Forex, Crypto-Assets, Blockchain, and Information Technology.